 By Hannah Monroe, SA2020 Neighborhoods Liaison at SAHA
Post 6 | Series Archive
When looking through the SA2020 indicators, you might have noticed something in the Neighborhoods cause area. There is a relatively new indicator: “Improve Housing and Transportation Index”. This indicator was identified during a series of meetings organized by the Neighborhoods cause area lead partners – SAHA and ULI San Antonio – during the spring of 2013. In these conversations, we realized that we couldn’t expect people to live inside Loop 410 if the cost of living there is too high. We also realized that, although there are lower housing costs the further you live from downtown, the transportation costs are higher.
Traditionally, affordability measures recommend that housing costs make up no more than 30% of household income. Transportation is often the second largest expense for families, but few consider these costs when choosing a place to live. The Center for Neighborhood Technology (CNT) and the Center for Transit Oriented Development (CTOD) propose that “a more complete measure of affordability is that combined housing and transportation costs take up no more than 45% of a household budget.”
The Housing + Transportation (H+T) Index expands the view and analysis of neighborhood affordability. It can help us figure out which neighborhoods are actually affordable to the people who live there. This is why SA2020 added this new indicator to the Neighborhoods cause area – and why it is a useful measurement for you as well.

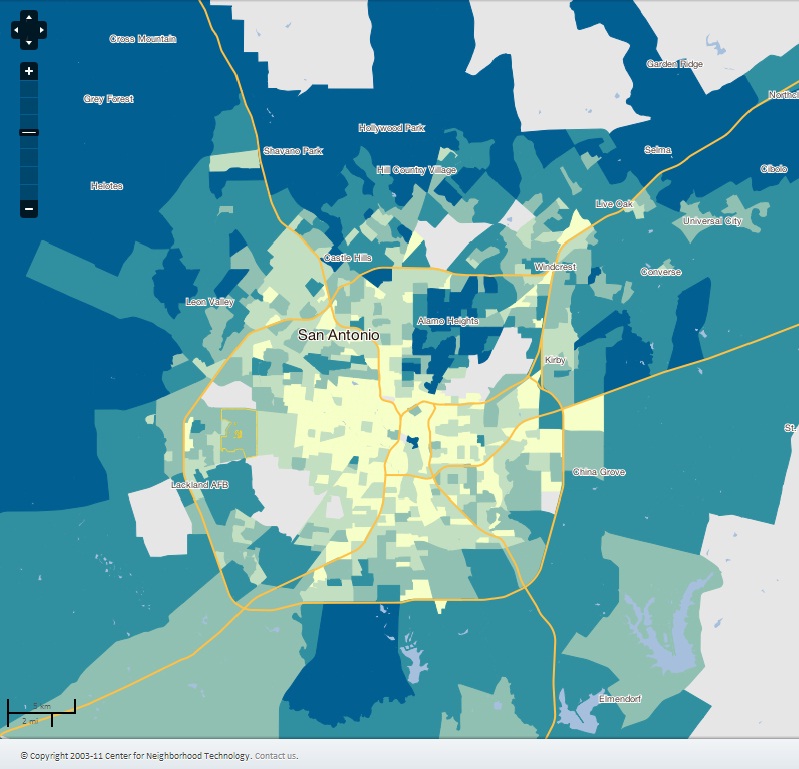
The Map
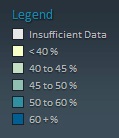
This map outlines the Housing + Transportation Affordability Index for census tracts (approximately a neighborhood) throughout the San Antonio region. Using the H + T Index, affordable neighborhoods are those where housing and transportation costs are no more than 45% of household income. The yellow and light blue areas are affordable neighborhoods – where the cost of housing and transportation makes up 45% or less of the total income of the households. The areas that are any darker shade of blue are neighborhoods where the cost of housing and transportation is higher than 45% of annual income. The darker the color blue, the higher the H + T Index is, and the less affordable the neighborhood.
Under the original view of neighborhood affordability, 89% of San Antonio neighborhoods were considered “affordable” to the typical household. But this does not provide a complete view of affordability. Using the H+T Index, about 45.2% of the neighborhoods in San Antonio are deemed affordable. 543,652 people (29.5% of the population) in the San Antonio region live in these affordable neighborhoods. This means that the majority of neighborhoods (54.9%) are not affordable and the majority of people (70.6%) are spending more than 45% of their annual income on housing and transportation alone.
The Goal
Our community created a vision for a future city that is “known for its cohesive neighborhoods with compelling and unique personalities.” To achieve this, our neighborhoods have to be affordable enough for people to live and thrive in.
SA2020 tracks this goal by improving the housing and transportation index. This can happen in a number of different ways, including improving access to affordable alternative transportation like bicycle lanes and public transportation. This is an interesting indicator because the strategy to affect it also connects to other SA2020 goals, things like downtown housing and public transit ridership.
How H+T Applies to You
By using the Center for Neighborhood Technology (CNT) H+T mapping system you can explore the H + T index across the city and find out how your neighborhood measures up. Explore the different factors the CNT uses to calculate housing and transportation affordability.
Brainstorm ways you can make your cost of living more affordable by exploring the cost of using of public transportation to decrease individual car usage. This also positively impacts the air quality index, an SA2020 goal for Environmental Sustainability!
