How to Explore the Community Data
- Explore the community data from each of the nine Result pages, which shows the Indicators prioritized by the community to measure San Antonio’s progress toward the shared vision. As you do, we invite you to be curious: “Why is this Indicator moving?” “Why is this Indicator not moving?” “What can Related Indicators tell me about the bigger picture?”
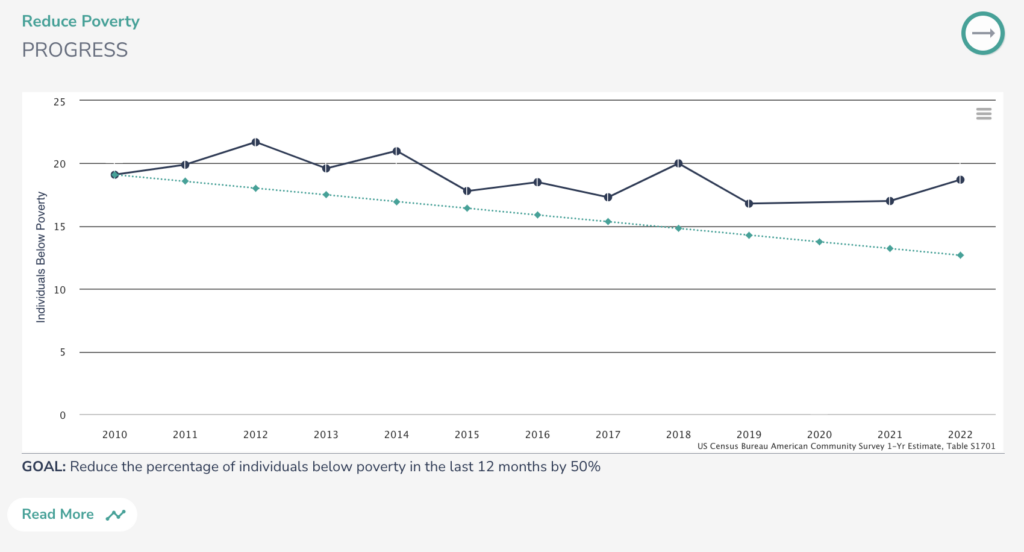
- Indicators are conditions of well-being for a total population. The icons following the Result statement show you the status of each indicator: 1) On Track to reach goal by 2030, 2) Making Progress toward the goal, but not at the rate necessary to reach the goal, 3) Off Track from the goal and moving in the wrong direction, 4) Baseline Only with only the first year of data available, or 5) In Development because we were unable to source reliable, annual data. (We have included these indicators in our final data update because local institutions, including the City of San Antonio, must prioritize making this data available to support transparent reporting on community progress.)
- The Result pages offer a snapshot of the data available for each Indicator. For Indicators that have a goal, the trend line shows you the annual progress necessary to reach the goal.

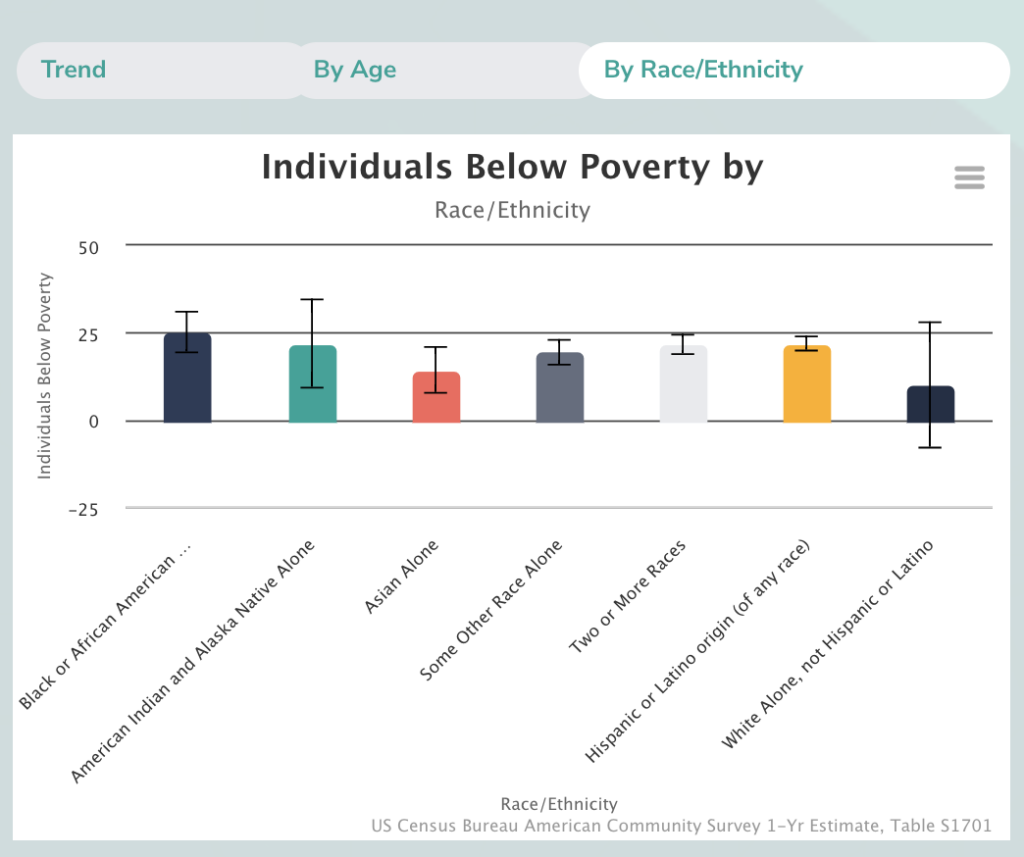
- Click on any Indicator and you’ll land on the Indicator Page for a closer look at “What the Data Shows” and “More of the Story.” SA2020 disaggregates data, where possible, by race, gender, age, and City Council District. If disaggregated data is available, you’ll see that at the top. (The demographic categories reported are consistent with the sources referenced. SA2020 promotes collecting inclusive demographic data.)

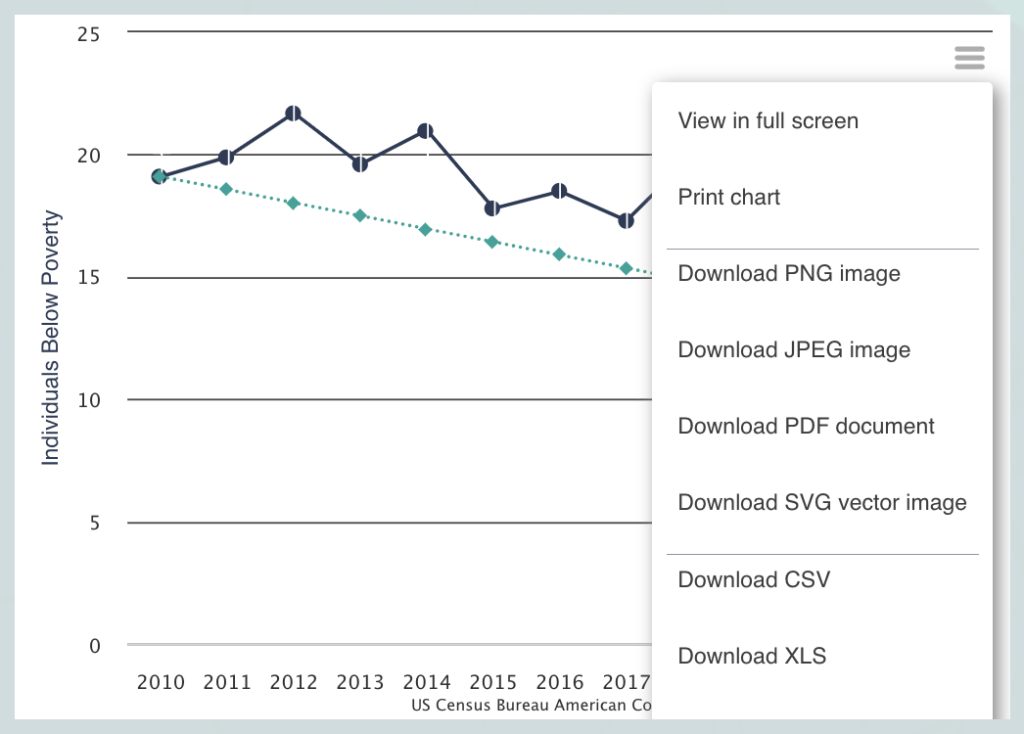
- To download a chart or its data, click the icon to the right of the title. You’ll see different options for saving the information as an image or spreadsheet.

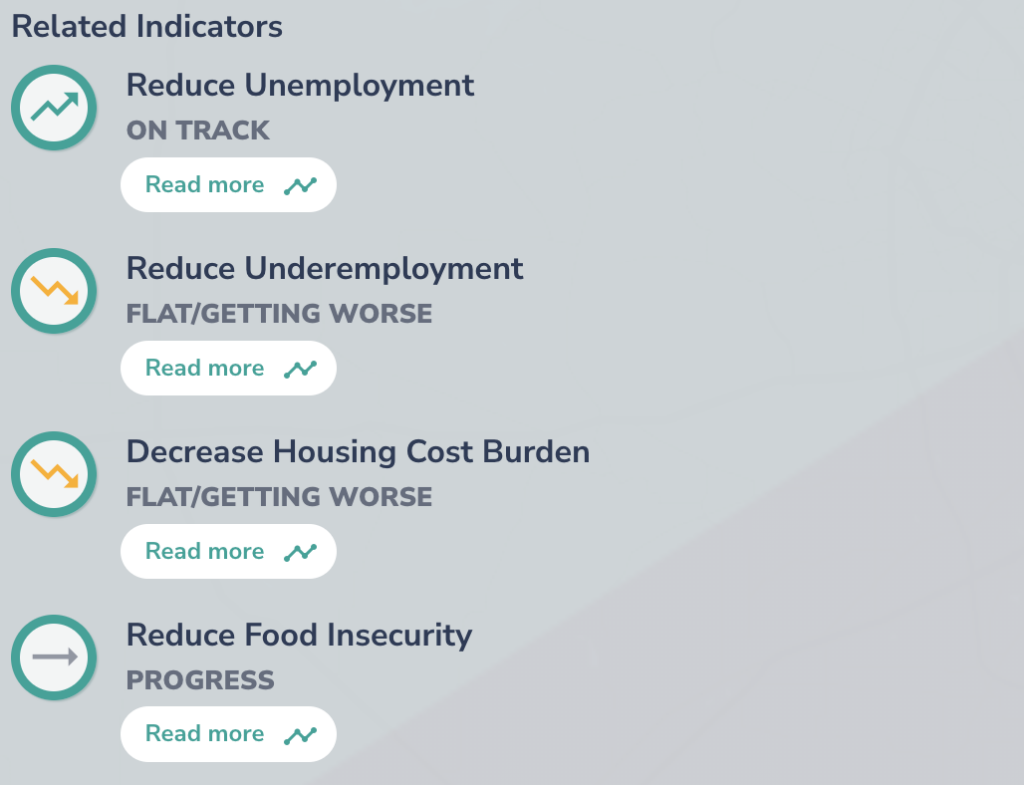
- On some Indicator pages, you’ll see a list of “Related Indicators.” This section helps you see how impact in one area of the Community Vision is tied to another.

